
Welcome to an incredible journey into the world of data exploration and analysis using Streamlit and Pygwalker. Get ready to experience the amazing capabilities of these powerful tools as we dive into the realm of interactive data visualization.

Introduction to Streamlit
Streamlit is a Python library that revolutionizes the process of transforming your data scripts into interactive web applications. With Streamlit, you no longer need to struggle with the complexities of web development and coding challenges. It provides a fast, open-source, and free solution for building and sharing data applications.
Introducing Pygwalker
Pygwalker is a popular Python library specifically designed for data analysis and visualization. It offers data scientists and analysts an intuitive interface for generating captivating visualizations like scatter plots, line plots, bar charts, and histograms. The best part? You don’t need any coding skills to utilize the full potential of Pygwalker!
To explore Pygwalker further and access more examples and resources, visit the official Pygwalker GitHub Page.
Getting Started with Streamlit and Pygwalker
Before we embark on our data exploration journey, let’s ensure that your computer is equipped with a Python environment (version 3.6 or higher). Once you have that set up, follow these steps:
Installation of Dependencies
Open your command prompt or terminal and run the following commands to install the necessary dependencies:
pip install pandas
pip install pygwalker
pip install streamlit
Integrating Pygwalker into a Streamlit Application
Now that we have all the dependencies installed, let’s create a Streamlit application that incorporates Pygwalker. Create a new Python script called pygwalker_demo.py and insert the following code:
import pygwalker as pyg
import pandas as pd
import streamlit.components.v1 as components
import streamlit as st

# Configure the Streamlit page
st.set_page_config(
    page_title="Using Pygwalker with Streamlit",
    layout="wide"
)

# Add a title
st.title("Using Pygwalker with Streamlit")

# Import your data
df = pd.read_csv("https://sample.csv")

# Generate the HTML using Pygwalker
pyg_html = pyg.walk(df, return_html=True)

# Embed the generated HTML into the Streamlit app
components.html(pyg_html, height=1000, scrolling=True)
Exploring Data with Pygwalker in Streamlit
To launch the Streamlit application and dive into your data exploration journey, run the following command in your command prompt or terminal:
streamlit run pygwalker_demo.py
You will see some information displayed on the terminal. Access the Streamlit app in your browser using the provided URL:
Local URL: http://localhost:8501
Network URL: http://xxx.xxx.xxx.xxx:8501
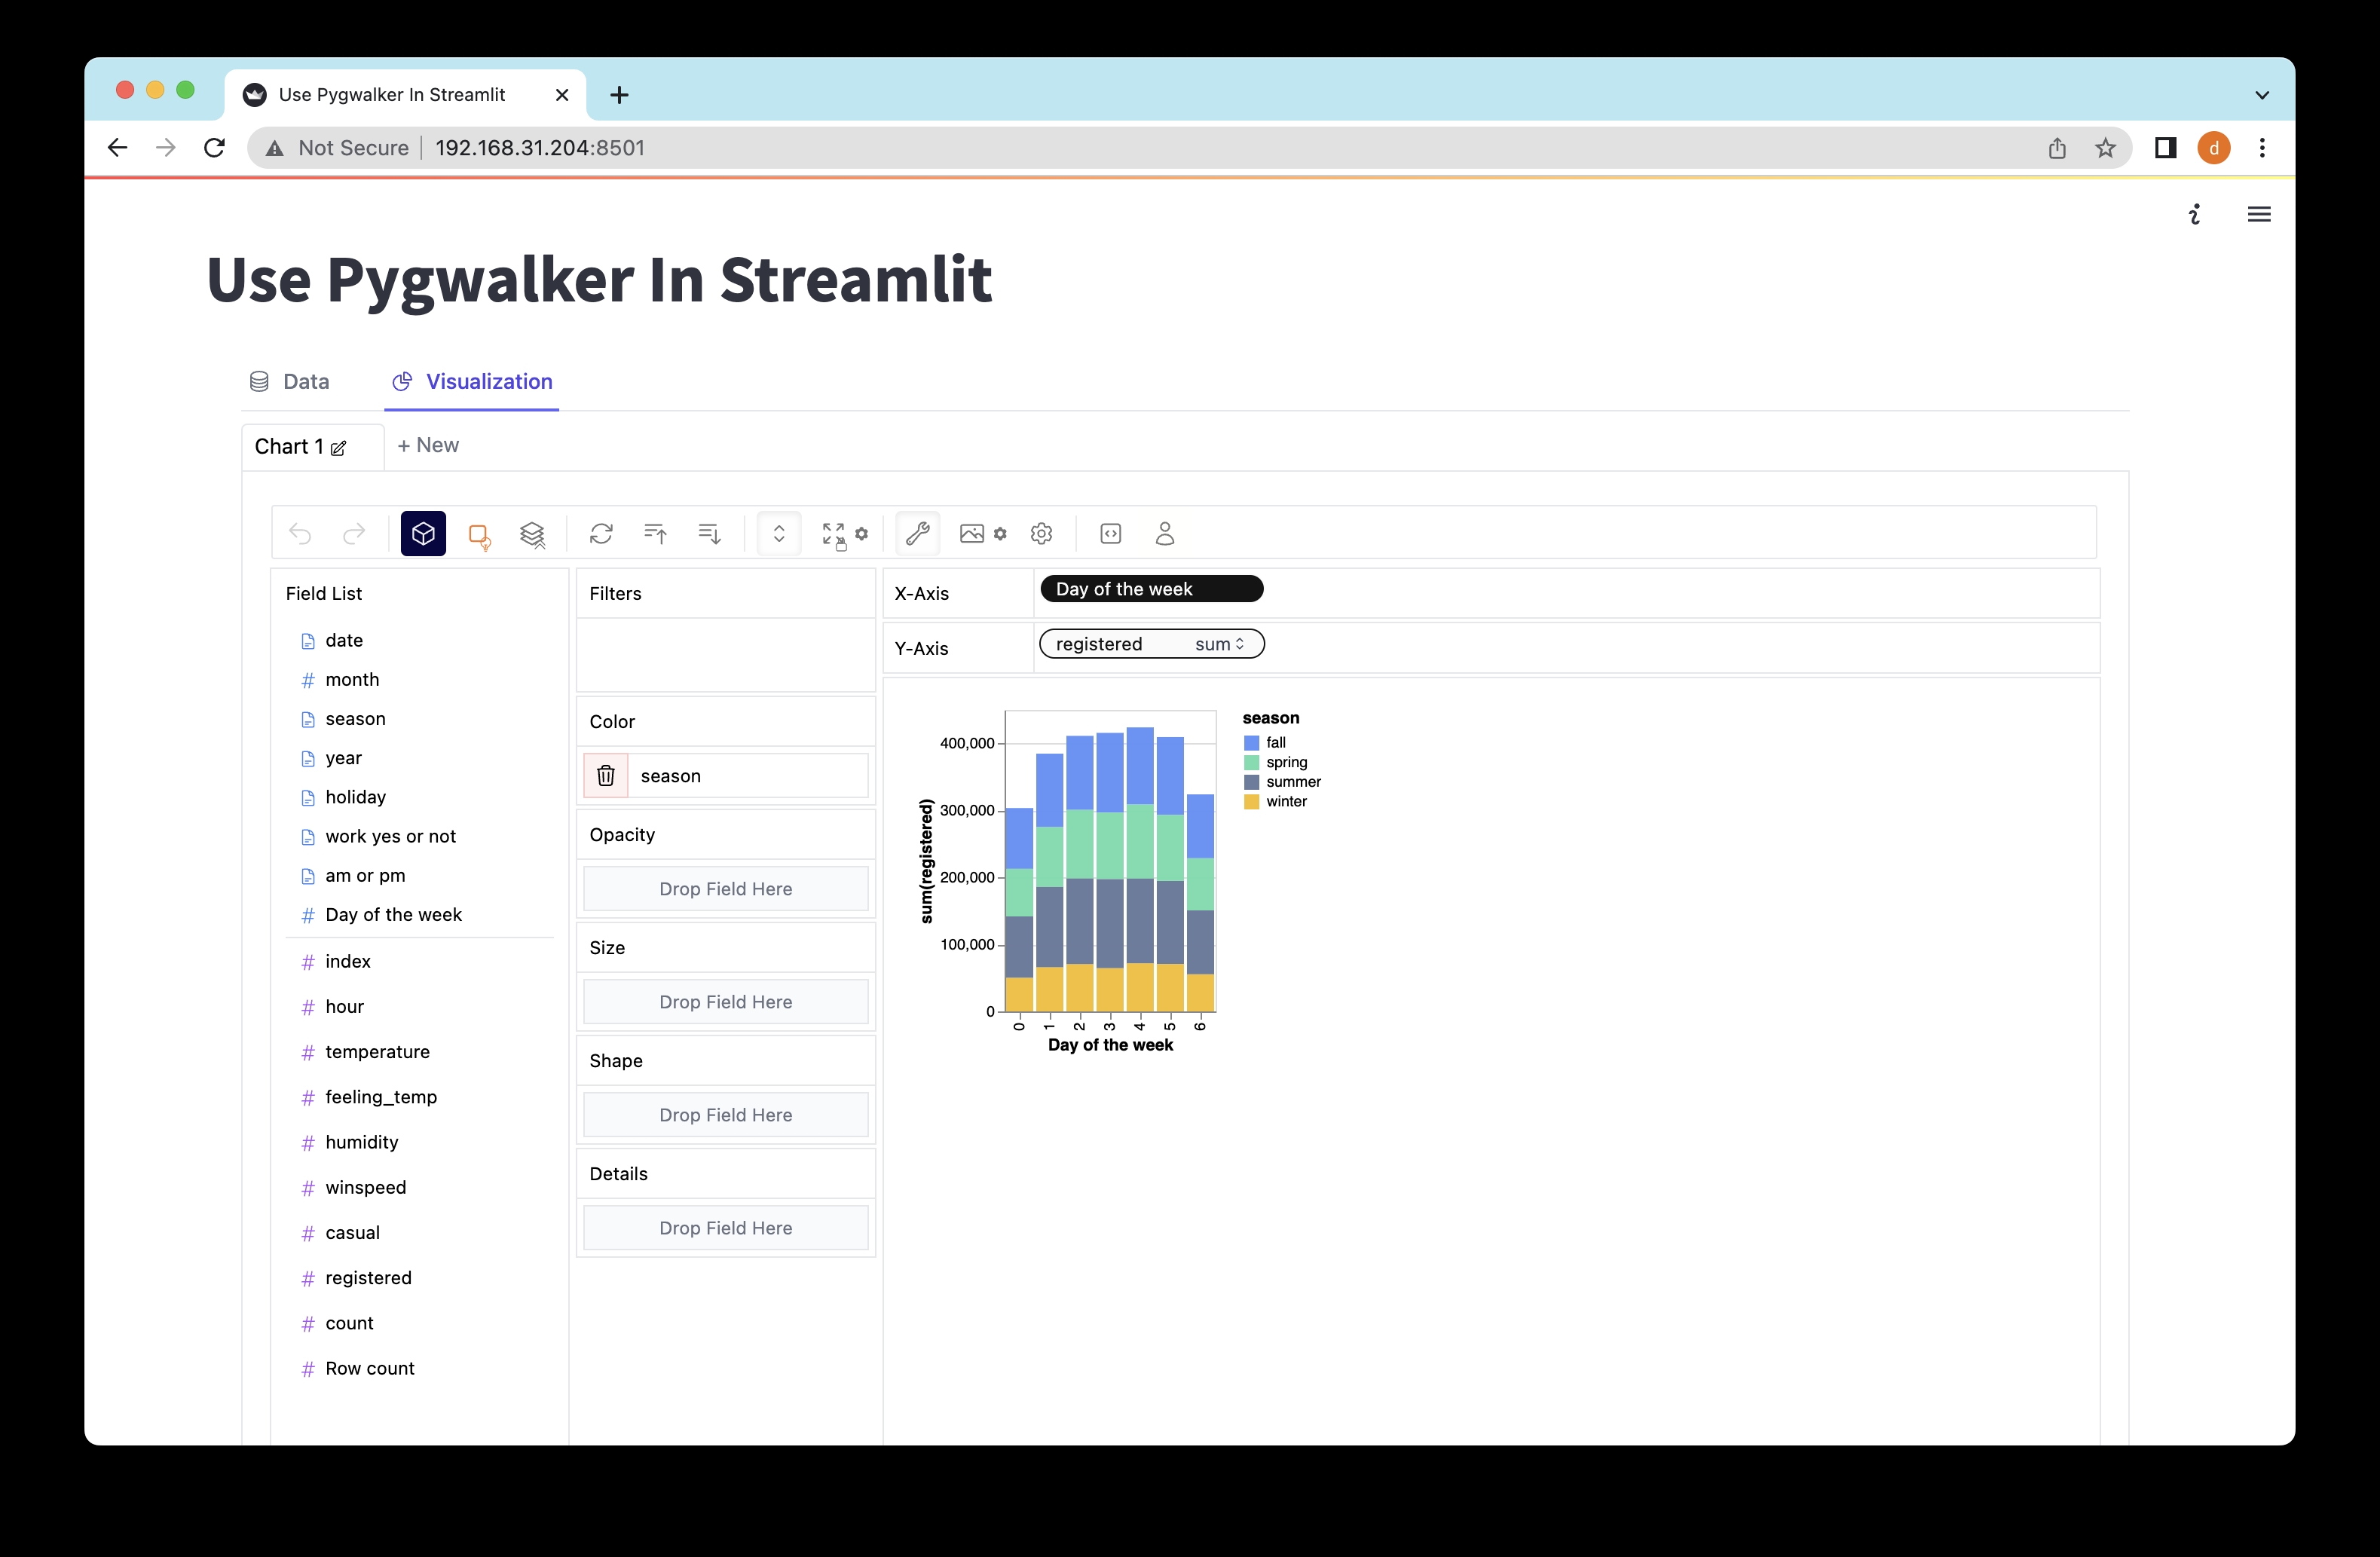
Open the provided URL (http://localhost:8501) in your web browser and witness the power of Pygwalker’s intuitive drag-and-drop actions for interactive data exploration and visualization.
Saving the State of a Pygwalker Chart
If you wish to save the state of a Pygwalker chart, follow these easy steps:
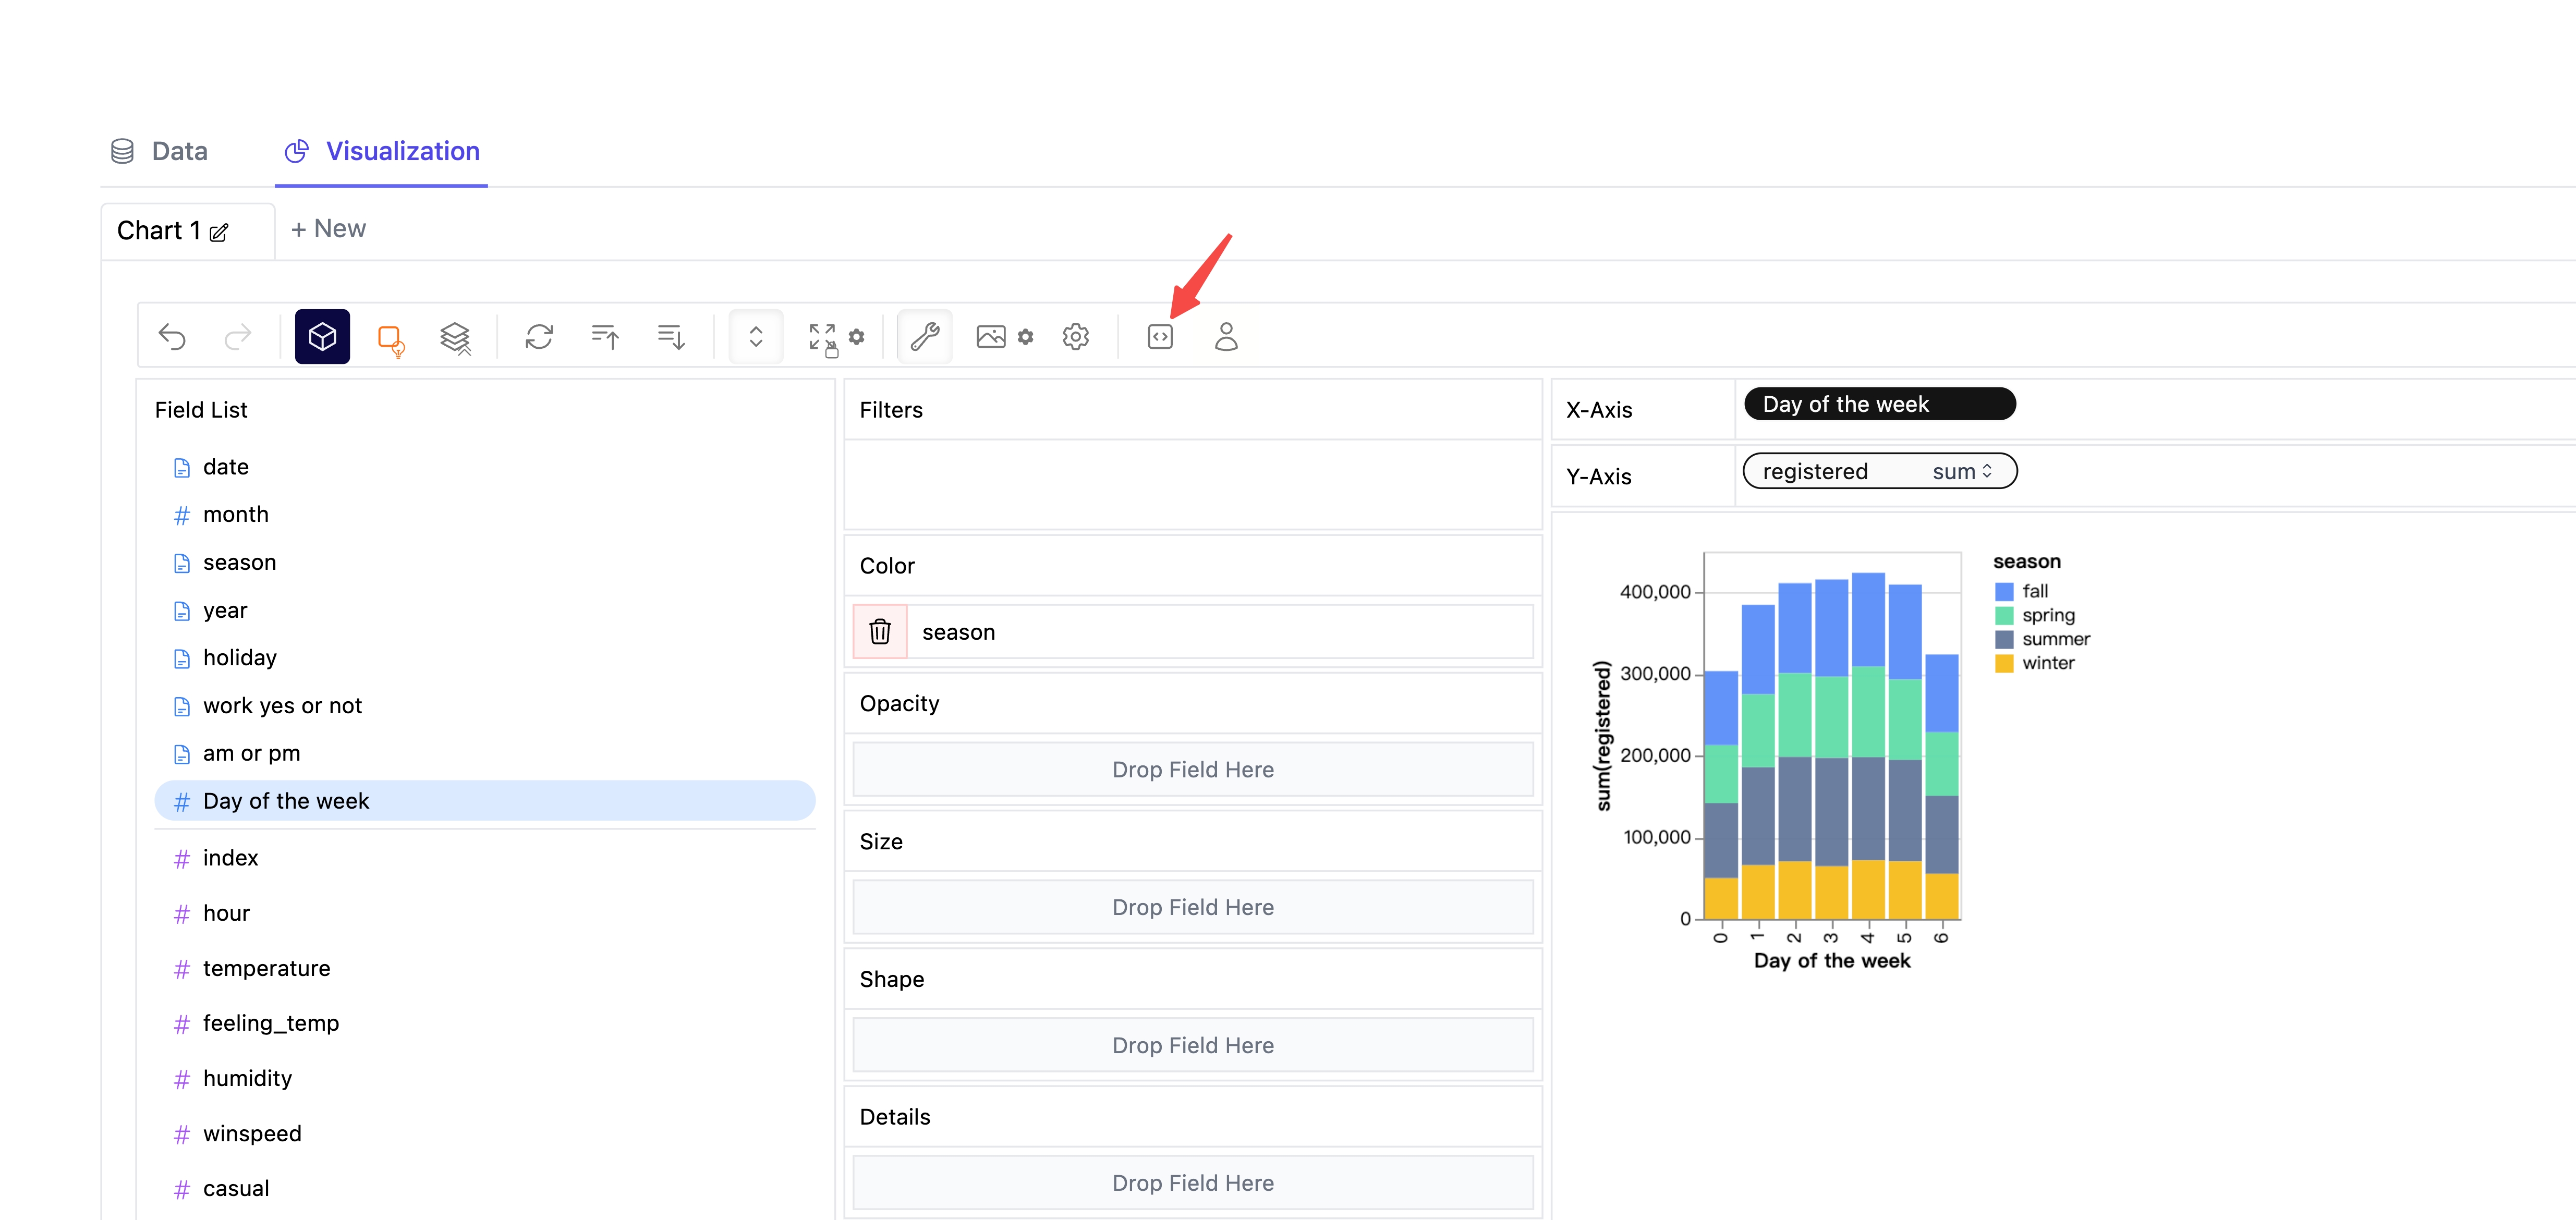
- Click the export button on the chart.

- Click the copy code button.
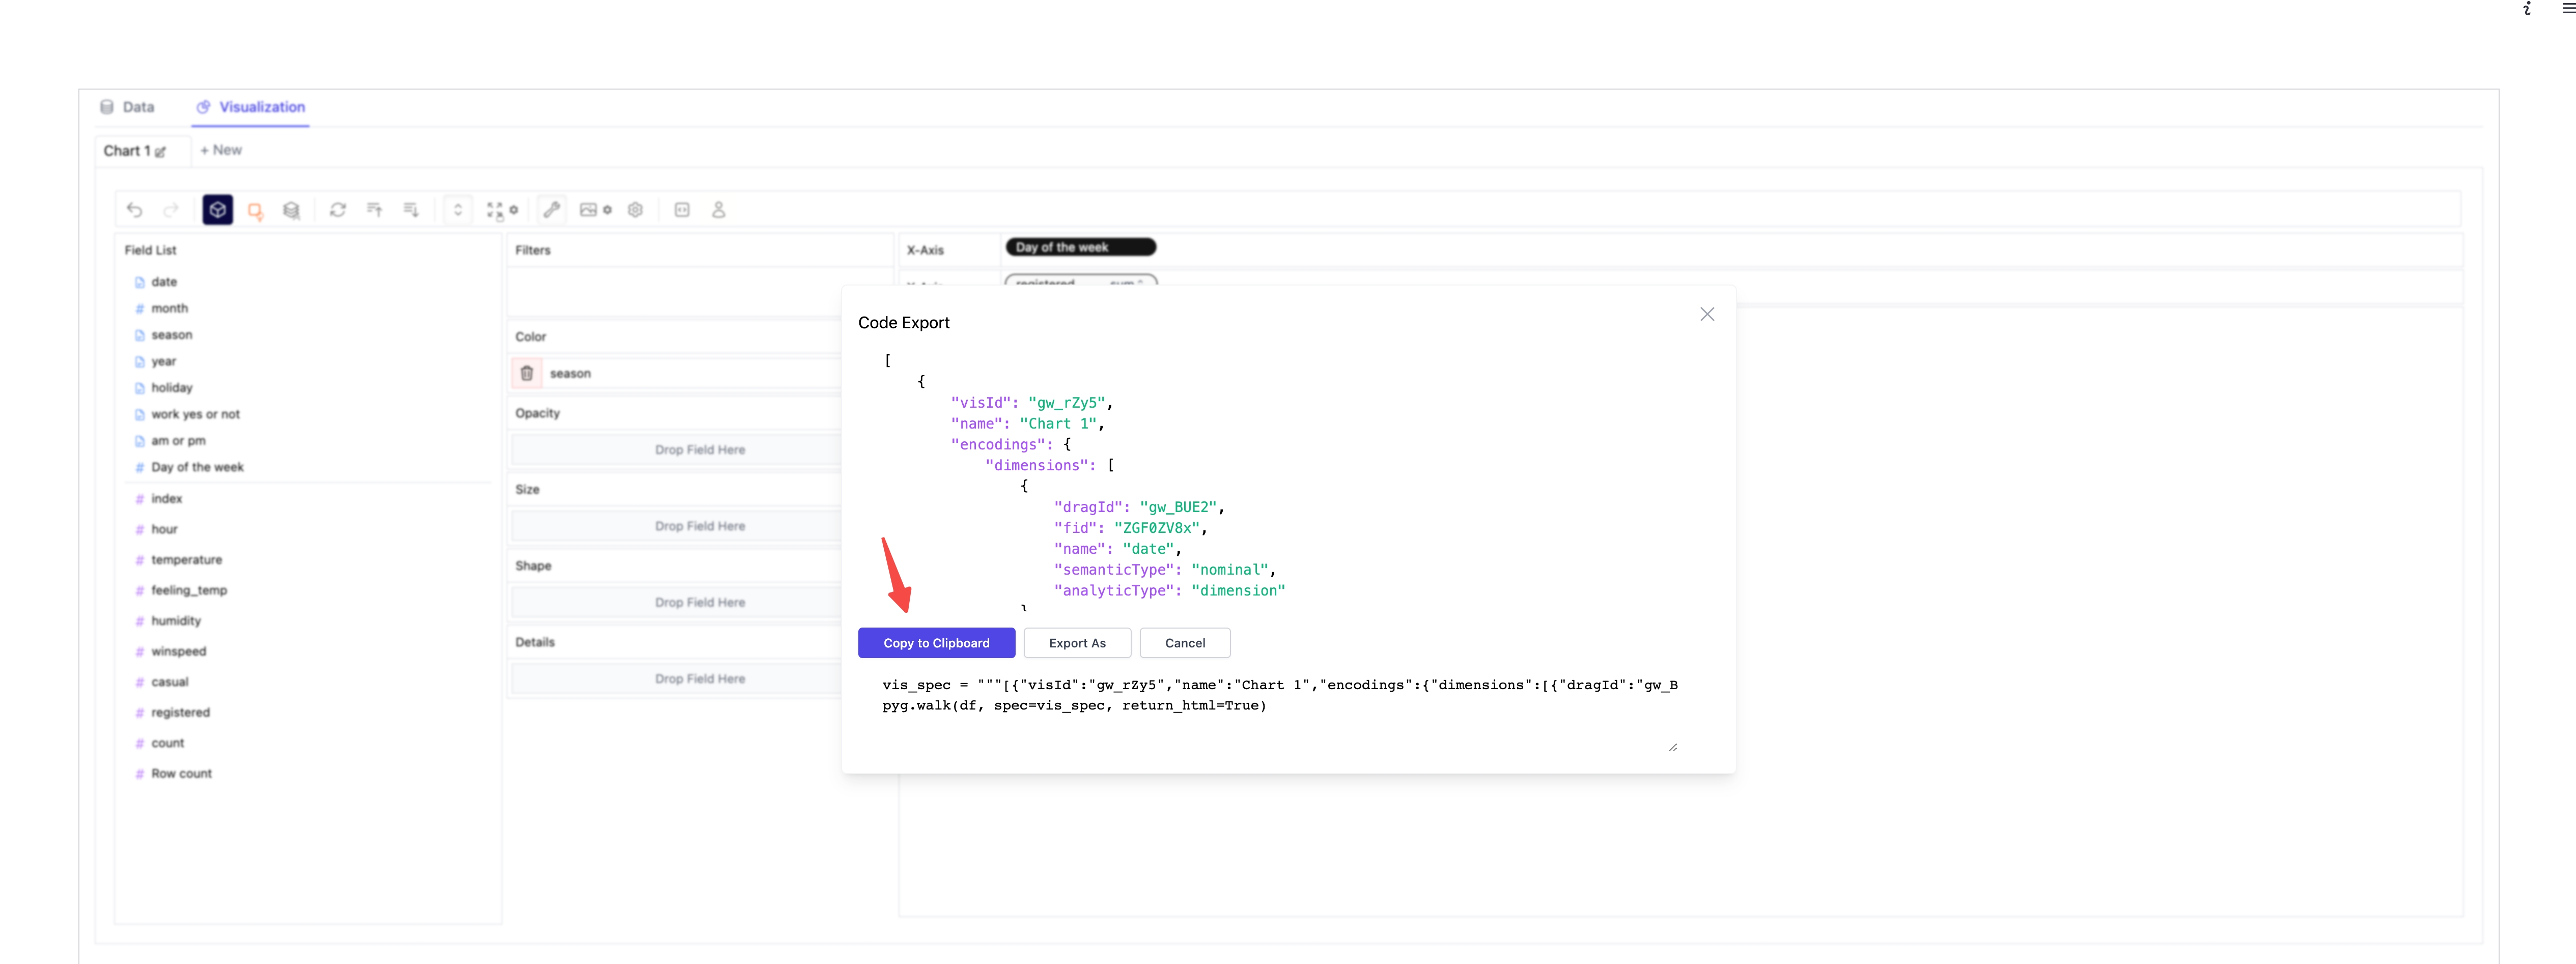
- Paste the copied code into your Python script where needed.
import pygwalker as pyg
import pandas as pd
import streamlit.components.v1 as components
import streamlit as st

# Configure the Streamlit page
st.set_page_config(
    page_title="Using Pygwalker with Streamlit",
    layout="wide"
)

# Add a title
st.title("Using Pygwalker with Streamlit")

# Import your data
df = pd.read_csv("https://kanaries-app.s3.ap-northeast-1.amazonaws.com/public-datasets/bike_sharing_dc.csv")

# Paste the copied Pygwalker chart code here
vis_spec = """<PASTE_COPIED_CODE_HERE>"""

# Generate the HTML using Pygwalker
pyg_html = pyg.walk(df, spec=vis_spec, return_html=True)

# Embed the generated HTML into the Streamlit app
components.html(pyg_html, height=1000, scrolling=True)
Remember to refresh the webpage to see the saved state of your Pygwalker chart.
It’s worth noting that Pygwalker is built upon graphic-walker, a powerful library that can be embedded in various platforms, including Excel and Airtable. This means that your Pygwalker app can easily collaborate with users in different environments, leveraging the capabilities of graphic-walker and Pygwalker.
Conclusion
Streamlit and Pygwalker are invaluable tools that simplify data exploration and facilitate effective communication of insights. Streamlit’s user-friendly interface and Pygwalker’s interactive visualization options seamlessly enhance your data analysis workflow. So go ahead, dive into your data, and share your remarkable insights with the world!
References
For more detailed information, refer to the documentation on how to use Streamlit with PyGWalker.

Leave a comment